Why in news?
Ministry of Statistics and Programme Implementation (MoSPI) released the GDP data for the first quarter of the current financial year (2021-22)
What are available data for Q1?
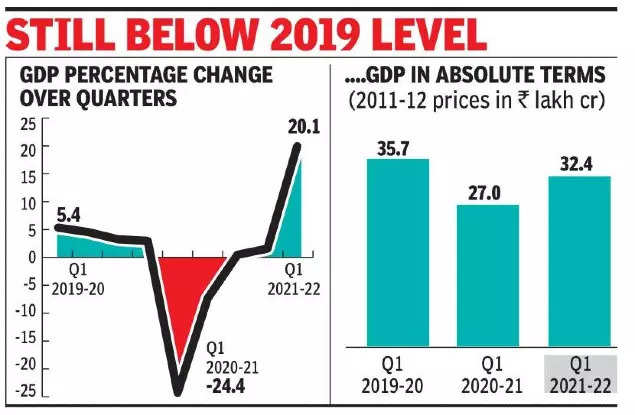
- Growth - Lockdown due to the pandemic had nearly halted all economic activities in April-June 2020. (GDP had contracted 24.4%).
- But the economy grew at a pace of 20.1% in April-June 2021 compared to April-June 2020.
- GVA grew by 18.8%
- This high growth rate has come despite a brutal 2nd wave of in April-May 2021.
- Characteristics - Certain high frequency indicators such as power generation, fuel consumption and railway freight indicated that rebound has been faster after Covid 2.0 than Covid 1.0.
- However the pace of recovery is still considered slow.
- GDP in absolute terms at Rs 32.38 lakh crore (constant prices) is still 9.2% lower than the GDP in pre-pandemic time.
- Sectors - Manufacturing and construction imparted a significant push to the economy growing at 49.63% and 68.3% respectively.
- But they are yet to reach the levels of the 2019-20.
- Services, especially contact-intensive sectors, however, continued to lag.
- Agriculture, forestry and fishing’ and ‘electricity, gas, water supply and other utility services are above the levels of the of 2019-20.
- In terms of expenditure, Private Final Consumption Expenditure grew 19.34%, and Gross Fixed Capital Formation jumped 55.26%.
- Private Final Consumption Expenditure - measure of consumer spending
- Gross Fixed Capital Formation - measure of private investment
What are the reasons?
- The sharp increases were largely due to the low base of the first quarter of 2020-21.
- The recovery is likely to deepen with further easing of curbs and faster vaccination.
How is the growth seen by experts?
- Chief Economic Adviser - GDP data for the 1st quarter reaffirms the government’s prediction of an imminent V-shaped recovery made last year.
- Others - The headline number cannot be interpreted as a V-shaped recovery.
- 2019-20 level was in itself seen as a disastrous year for growth.
- And the the fact that the economy has still not recovered to those levels is not good news.
- The 2nd quarter numbers would be the real test of the shape of the recovery.
What does this call for?
- As the growth is below the RBI’s projection of 21.4%, it will maintain status quo on key policy rates
- A full economic recovery would require the support of both fiscal and monetary policies
- From a policy perspective, recovery requires fuller levels of vaccination and improved public confidence
GDP vs GVA
- GDP- GDP is the total monetary value of final goods and services produced in a country in a given period of time
- It measures the value of total output in the economy by tracking the total demand
- GVA - GVA looks at how much value was added (in money terms) in different productive sectors of the economy
- It tracks the total output in the economy by looking at the total supply
- The total output calculated by GDP and GVA should be the same but every economy has a government which imposes taxes and also provides subsidies, thus
GDP = (GVA) + (Taxes earned by the government) — (Subsidies provided by the government)
- If the government earned more from taxes than what it spent on subsidies, GDP will be higher than GVA
- If the government provided subsidies in excess of its tax revenues, GVA would be higher than GDP
Source: The Indian Express
